
Here’s a handy two-part chart that you can use to quickly assess the odds that you have to make your hand based on the outs you have remaining.

The first column (orange) represents the number of outs you have with the fourth column (purple) giving examples as a quick reference. The second column (blue) represents the chance you have to make your hand with two cards to come, expressed in both percentage and odds. The third column (green) shows your chances to make a hand with one card to draw, also expressed in both percentages and odds.
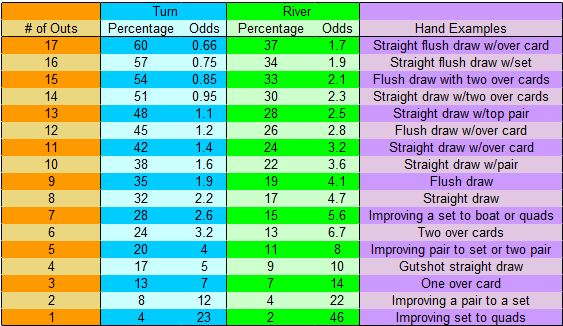
Now that you know your basic odds, you can use this information to determine if you have “pot odds” to make a call when facing a bet. First thing you need to do, is take the percentage chance you have to make you hand and multiply that by the amount of pot plus the size of the bet. That number will tell you the maximum amount you can call when facing a bet.
For example, let us say you are facing a bet of $5 into a $45 pot on the turn. You currently have two over cards and think if you can at least pair one of those cards, you’ll win the hand.
With two over cards, you have 6 outs to hit your pair so according to our chart that gives you 24% chance on the turn.
- 0.24 * $50 = $12
Since the bet is under $12, you have the pot odds to call the $5 bet.